

![]() It’s now possible to track natural gas consumption in real time, and here’s why you should. Knowing your consumption in real time makes it possible to associate consumption data with specific internal and external factors. These associations enable insights and actions into making improvements in key performance indicators (KPIs) like energy efficiency, conservation, and sustainability.
It’s now possible to track natural gas consumption in real time, and here’s why you should. Knowing your consumption in real time makes it possible to associate consumption data with specific internal and external factors. These associations enable insights and actions into making improvements in key performance indicators (KPIs) like energy efficiency, conservation, and sustainability.
Looking at energy consumption in real time is not new. Electrical power consumption has long been available in real time. That data is used by customers for behind-the-meter consumption analysis and benchmarking, by electrical utilities to determine demand rates, and for demand response. In the case of real time natural gas consumption data, knowledge of the data by the customer has even broader and more powerful uses.
Using Real Time Natural Gas Consumption Data
Real time consumption tracking is useful for benchmarking and consumption analysis. For example, matching up the rate of natural gas consumption in real time with indoor and outdoor temperatures, time of day, and other factors is useful for making comparisons with similar buildings. Comparing the performance of “Retrofit A” vs. “Retrofit B” with real time data is a powerful way to maximize financial outcomes and system optimizations.
Building dynamics can be determined and used to reduce wasted energy. If the data show that consumption causes indoor temperatures to overshoot their targets (e.g. on sunny mornings), a case can be made for installing a proactive energy control system. A similar analysis can be used for cooling applications that use natural gas fired chillers.
For larger portfolios of buildings, benchmarking the KPIs of similar buildings, then applying an energy conservation technology to one of the buildings will quickly demonstrate how much energy can be saved with that conservation technology. From there, ROI calculations can be made to determine if that conservation measure should be applied to the other buildings.
Faster, More Accurate Insights
Having consumption data available in real time yields faster and more accurate insights. The problem with the commonly used method of analyzing monthly billing data is that there’s a lot of useful information that’s missing because it’s impossible to extract it from the data. Billing data may include degree heating days and/or degree cooling days to match up with the consumption data, but that level of granularity has limited usefulness. First of all, the data that adds up to degree days provides very little potential for drawing actionable insights. The data doesn’t tell you what temperatures were and when (e.g. nights, weekends, etc) and what other factors were present, such as sunlight, wind, and occupancy level. Whatever insights that can be derived from the billing data might take a whole heating season to compile, and even then the conclusions might still be missing the mark.
Real time data can be used to separate out or factor in variables. In some cases it’s even possible to turn on and off energy saving features, adjust heating curves, or the like. Doing so can help to quantify the level of impact from the new feature or setting.
Real Time Energy Use Intensity (EUI)
For the purpose of illustration, here’s a simplified example of an hour by hour comparison of energy use intensity (EUI) on a scale of 1-10 over the course of 24 hours. Lower average EUI with the same external factors yields lower energy costs and lower emissions.
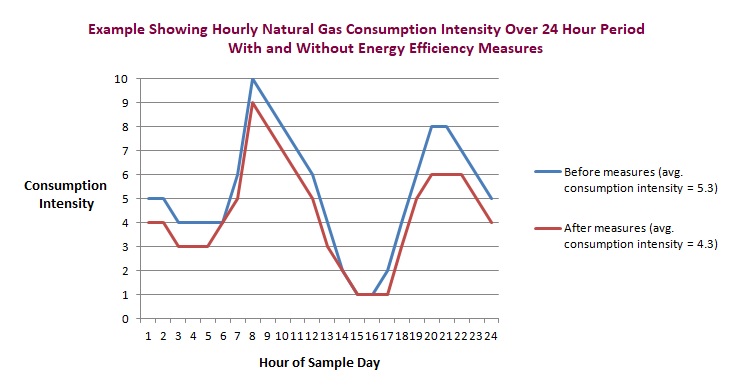
The chart shows average hourly EUI dropping from 5.3 to 4.3 over two “identical” 24 periods. Lowering EUI by approximately 10%, as in this example, is a substantial gain in efficiency. In reality, data can be obtained in even shorter time increments for an even greater level of granularity. As the data would be reported in therms (or similar), it becomes easier to calculate costs and savings.
Natural Gas Consumption, Carbon Emissions and Carbon Tax
In addition to saving money through reduced consumption, building owners, managers, and REIT investors also gain knowledge and insight regarding the quantity of CO2 emissions that are eliminated by lowering gas consumption. Lowering CO2 emissions has value, but the dollar value is difficult to quantify today. However, wherever a price is put on carbon emissions, those calculations become straightforward and readily available.
Next Steps
Contact CIMI Energy to learn more about tracking your natural gas consumption in real time.
CIMI Energy uses Energy Star Portfolio Manager and other tools to turn your real time data into action .
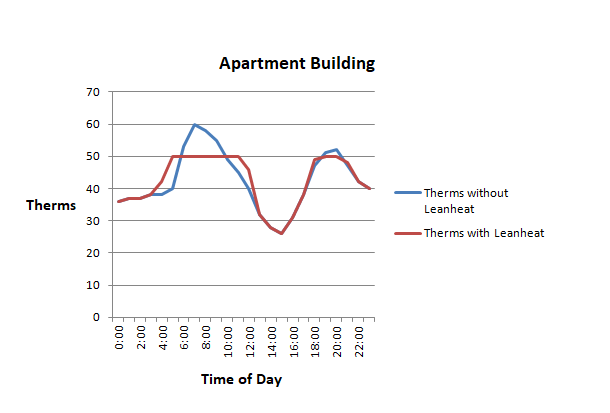 The example shows the exact same consumption over the 24 hour period. The only difference between the two is that the red line is flatter, spreading out the demand, and maxing out at 50 therms/hour, a 17% reduction from the 60 therm/hour peak.